15:52
Evolución del gasto de la ULPGC 2016-2024
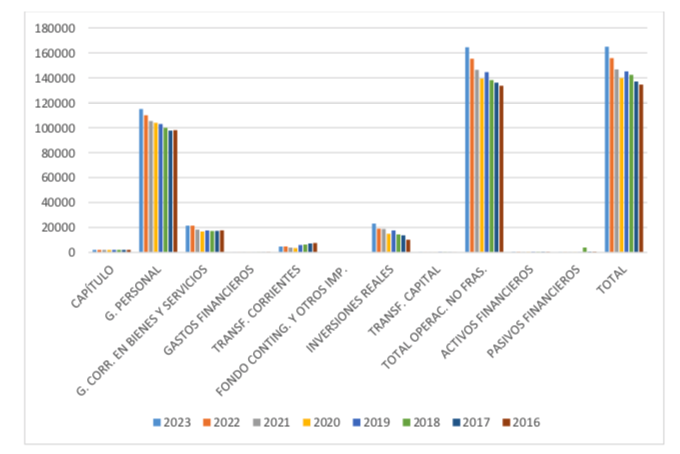
Evolución de las obligaciones reconocidas por capítulo (miles de euros) (período 2016-2024)
Fuente: Tomo I.- Cuentas Anuales ULPGC 2024 |pdf| |docx| |odt| actualizado
Fuente: Tomo I.- Cuentas Anuales ULPGC 2023 |pdf| |docx| |odt|
Fuente: Tomo I.- Cuentas Anuales ULPGC 2022 |pdf| |docx| |odt|
Fuente: Tomo I.- Cuentas Anuales ULPGC 2021 |pdf| |docx| |odt|
CAPÍTULO |
2024 |
2023 |
2022 |
2021 |
2020 |
2019 |
2018 |
2017 |
2016 |
|
GASTOS DE PERSONAL |
120.345,42 |
114.981,18 |
109.969,28 |
105.327,21 |
103.909,76 |
102.948,53 |
99.882,24 |
97.651,27 |
98.026,47 |
|
GASTOS CORRIENTES EN BIENES Y SERVICIOS |
21.966,59 |
21.465,40 |
21.436,21 |
18.272,83 |
16.834,39 |
17.605,70 |
17.163,21 |
17.250,47 |
17.692,87 |
|
GASTOS FINANCIEROS |
82,16 |
58,01 |
44,57 |
110,44 |
38,14 |
79,76 |
161,04 |
136,20 |
186,00 |
|
TRANSFERENCIAS CORRIENTES |
6.618,83 |
4.728,54 |
4.801.08 |
3.859,24 |
3.548,01 |
5.942,63 |
6.322,00 |
7.139,36 |
7.531,80 |
|
INVERSIONES REALES |
21.878,11 |
23.104,99 |
18.980,12 |
18.787,96 |
14.997,91 |
17.590,73 |
14.434,14 |
13.723,23 |
10.147,74 |
|
TRANSFERENCIAS DE CAPITAL |
146,65 |
99,56 |
7,66 |
8,34 |
58,89 |
386,49 |
212,17 |
137,93 |
0,73 |
|
TOTAL OPERACIONES NO FINANCIERAS. |
171.038.38 |
164.437,68 |
155.265,92 1 |
146.366,02 |
139.387,11 |
144.553,84 |
138.174,81 |
136.038,46 |
133.585,61 |
|
ACTIVOS FINANCIEROS |
255,83 |
341,90 |
362,71 |
229,20 |
295,58 |
394,72 |
322,24 |
389,20 |
349,97 |
|
PASIVOS FINANCIEROS |
119,12 |
118,22 |
117,32 |
116,42 |
116,67 |
130,91 |
3.896,49 |
583,23 |
576,27 |
TOTAL PRESUPUESTO DE GASTOS |
171.413,33 |
164.897,79 |
155.745,95 |
146.711,65 |
139.799,35 |
145.079,47 |
142.393,54 |
137.010,89 |
134.511,85 |
Variación anual de las obligaciones reconocidas por capítulo (2016-2024) actualizado
|
|
2024/2017 |
2024/2023 |
|
|
2022/2016 |
2022/2021 |
2021/2016 |
2021/2020 |
2020/2019 |
2019/2018 |
2018/2017 |
2017/2016 |
||
|
GASTOS DE PERSONAL |
23,24% |
4,65% |
17,3% |
4,6% |
12,2% |
4,4% |
7,4% |
1,4% |
0,9% |
3,1% |
2,3% |
-0,4% |
||
|
GASTOS CORRIENTES EN BIENES Y SERVICIOS |
27,34% |
2,33% |
21,3% |
0% |
21,3% |
17,5% |
3,3% |
8,5% |
-4,4% |
2,6% |
-0,5% |
-2,5% |
||
|
GASTOS FINANCIEROS |
-39,68% |
41,63% |
-68,8% |
30,2% |
-76,0% |
-59,6% |
-40,6% |
189,5% |
-52,2% |
-50,5% |
18,2% |
-26,8% |
||
|
TRANSFERENCIAS CORRIENTES |
-7,39% |
39,98% |
-37,2% |
-1,5% |
-36,3% |
-24,4% |
-48,8% |
8,8% |
-40,3% |
-6,0% |
-11,4% |
-5,2% |
||
|
INVERSIONES REALES |
59,42% |
-5,31% |
127,7% |
21,7% |
87,0% |
1,0% |
85,1% |
25,3% |
-14,7% |
21,9% |
5,2% |
35,2% |
||
|
TRANSFERENCIAS DE CAPITAL |
6,32% |
47,3% |
13602,7% |
1199,9% |
954,1% |
-8,2,0% |
1048,1% |
-85,8% |
-84,8% |
82,2% |
53,8% |
18883,7% |
||
|
TOTAL OPERACIONES NO FINANCIERAS |
25,73% |
4,01% |
23,1% |
5,9% |
16,2% |
6,1% |
9,6% |
5,0% |
-3,6% |
4,6% |
1,6% |
1,8% |
||
|
ACTIVOS FINANCIEROS |
-34,27% |
-25,17% |
-2,3% |
-5,7% |
3,6% |
58,2% |
-34,5% |
-22,5% |
-25,1% |
22,5% |
-17,2% |
11,2% |
||
|
PASIVOS FINANCIEROS |
-79,57% |
0,76% |
-79,5% |
0,8% |
-79,6% |
0,08% |
-79,8% |
-0,2% |
-10,9% |
-96,6% |
568,1% |
1,2% |
||
TOTAL |
25,11% |
3,95% |
22,6% |
5,9% |
15,8% |
6,2% |
9,1% |
4,9% |
-3,6% |
1,9% |
3,9% |
1,9% |
Obligaciones reconocidas en 2017-2024 (miles de euros)
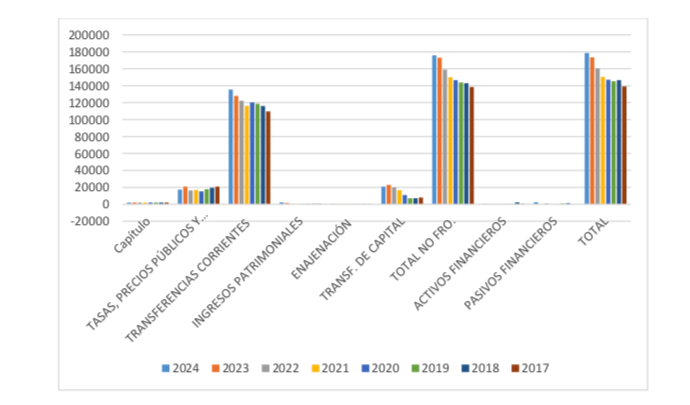
Obligaciones reconocidas en 2016-2023 (miles de euros)